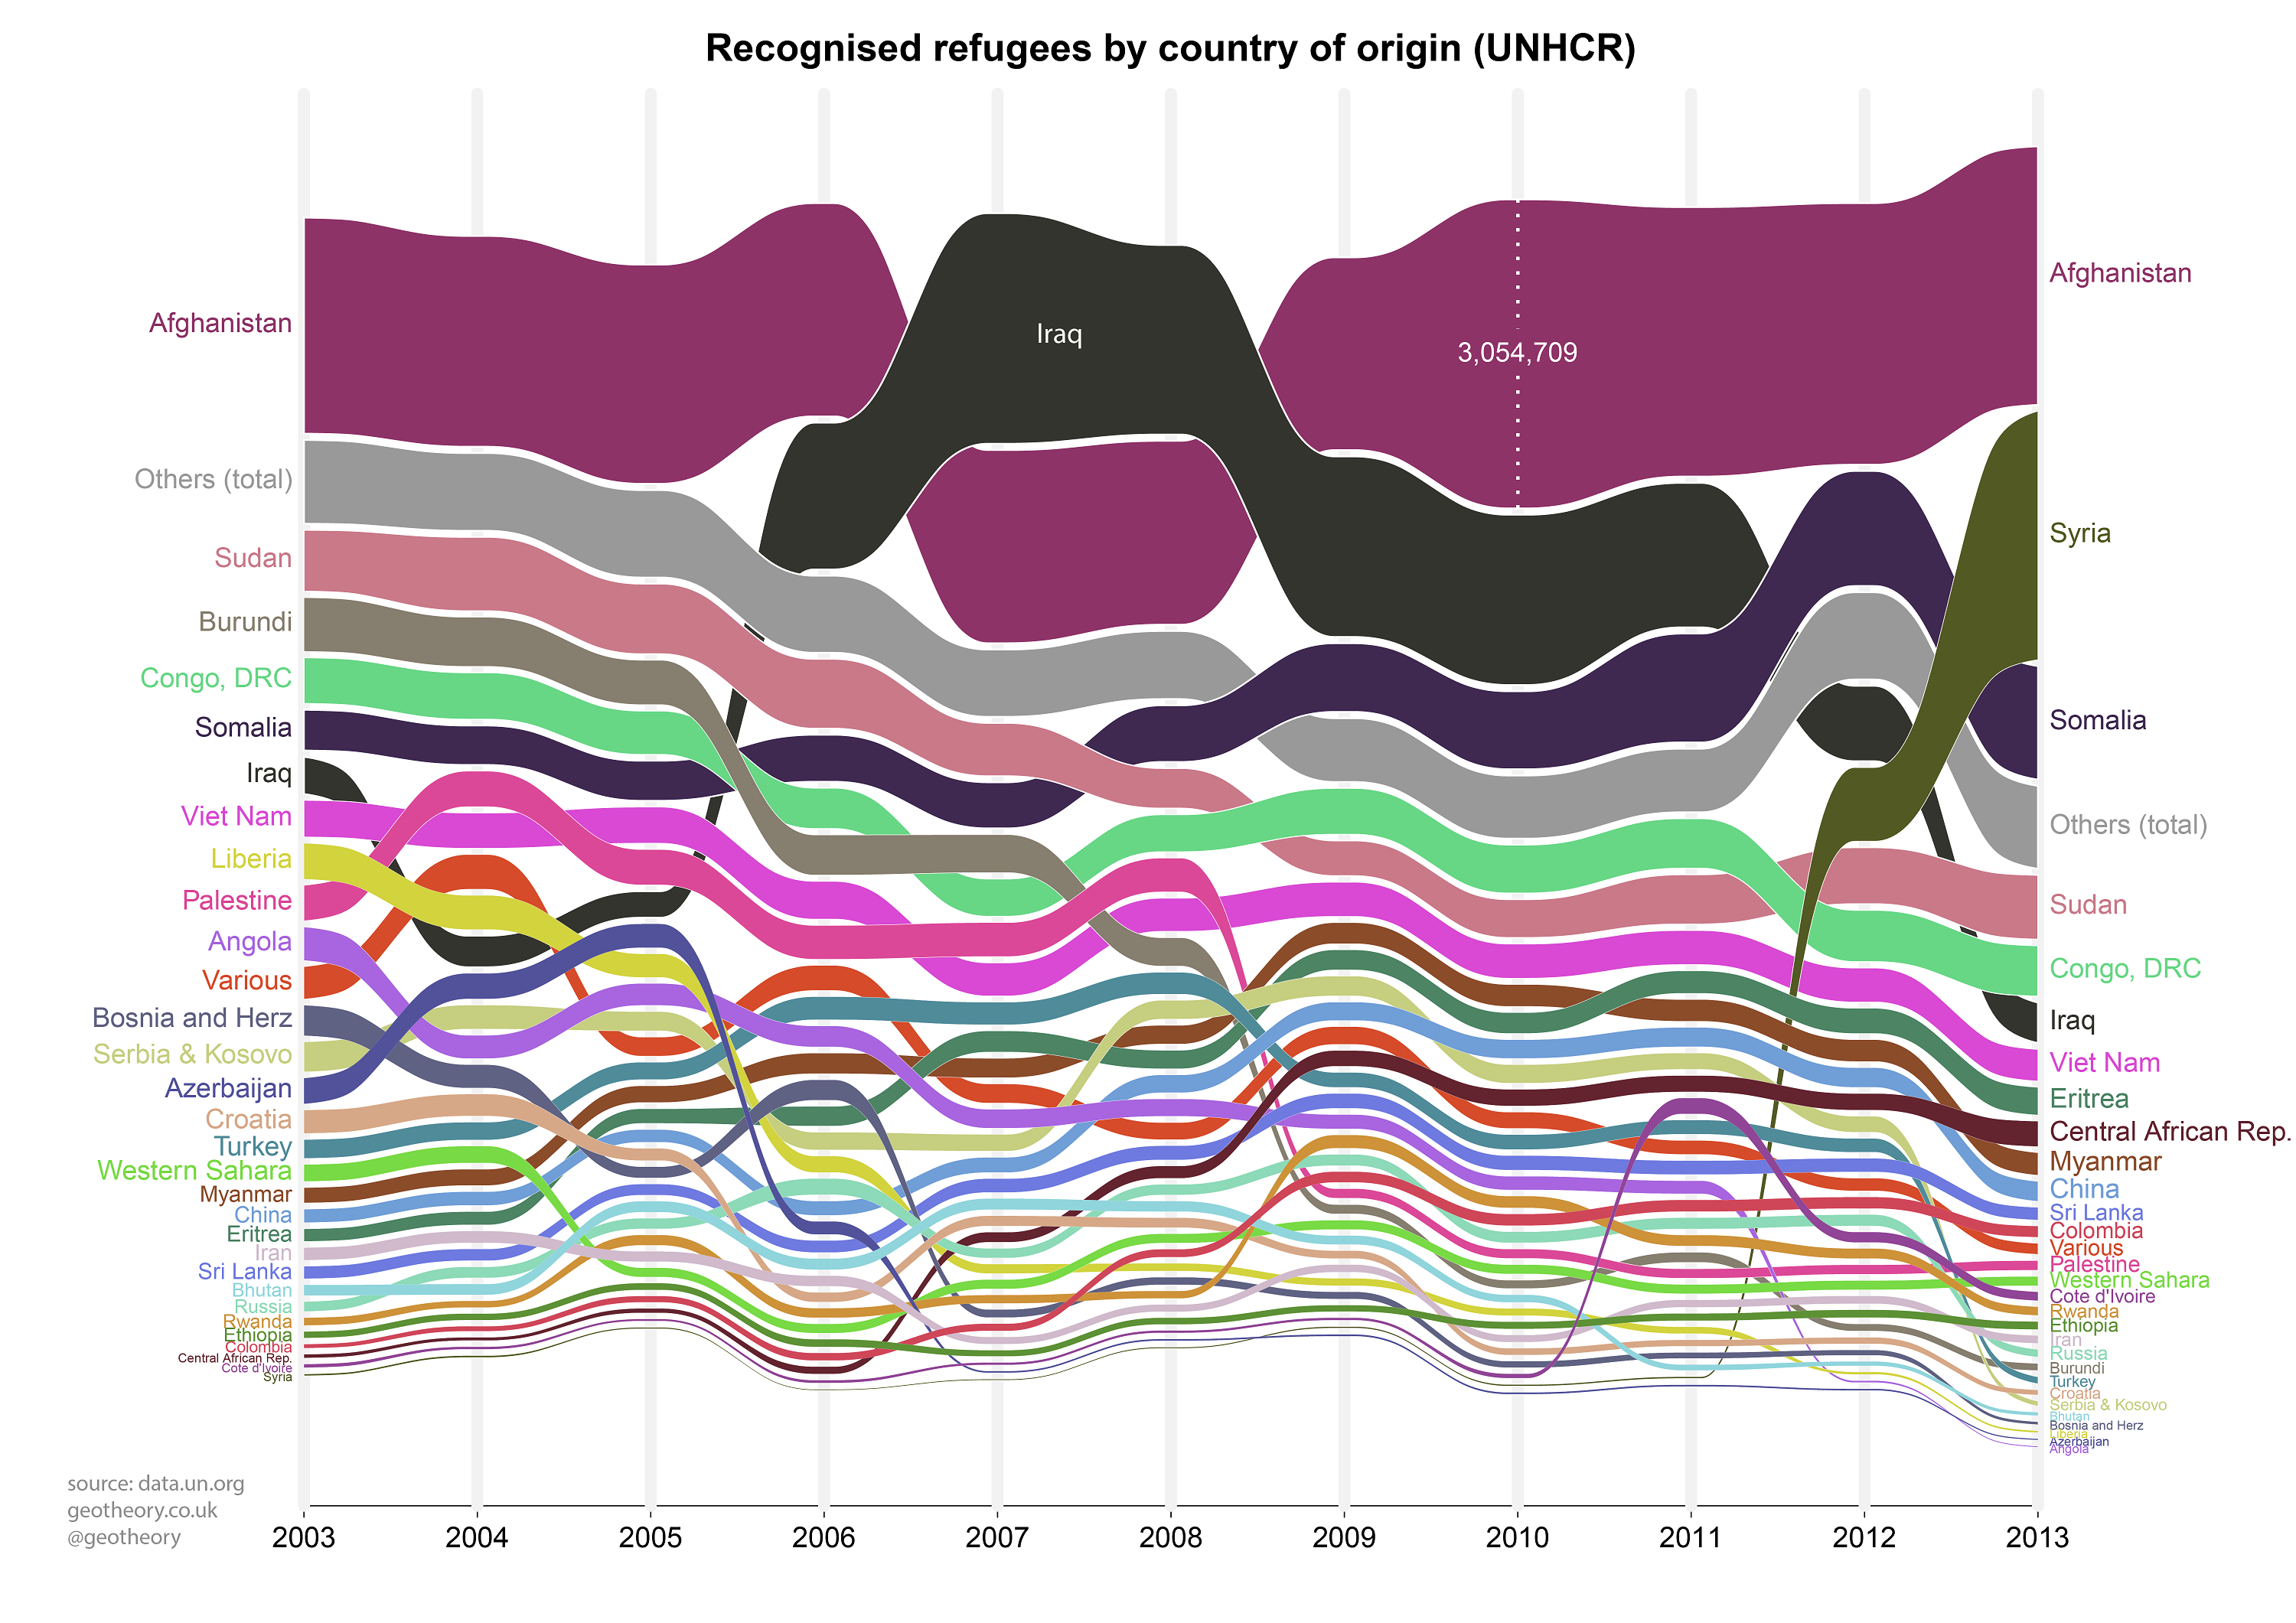
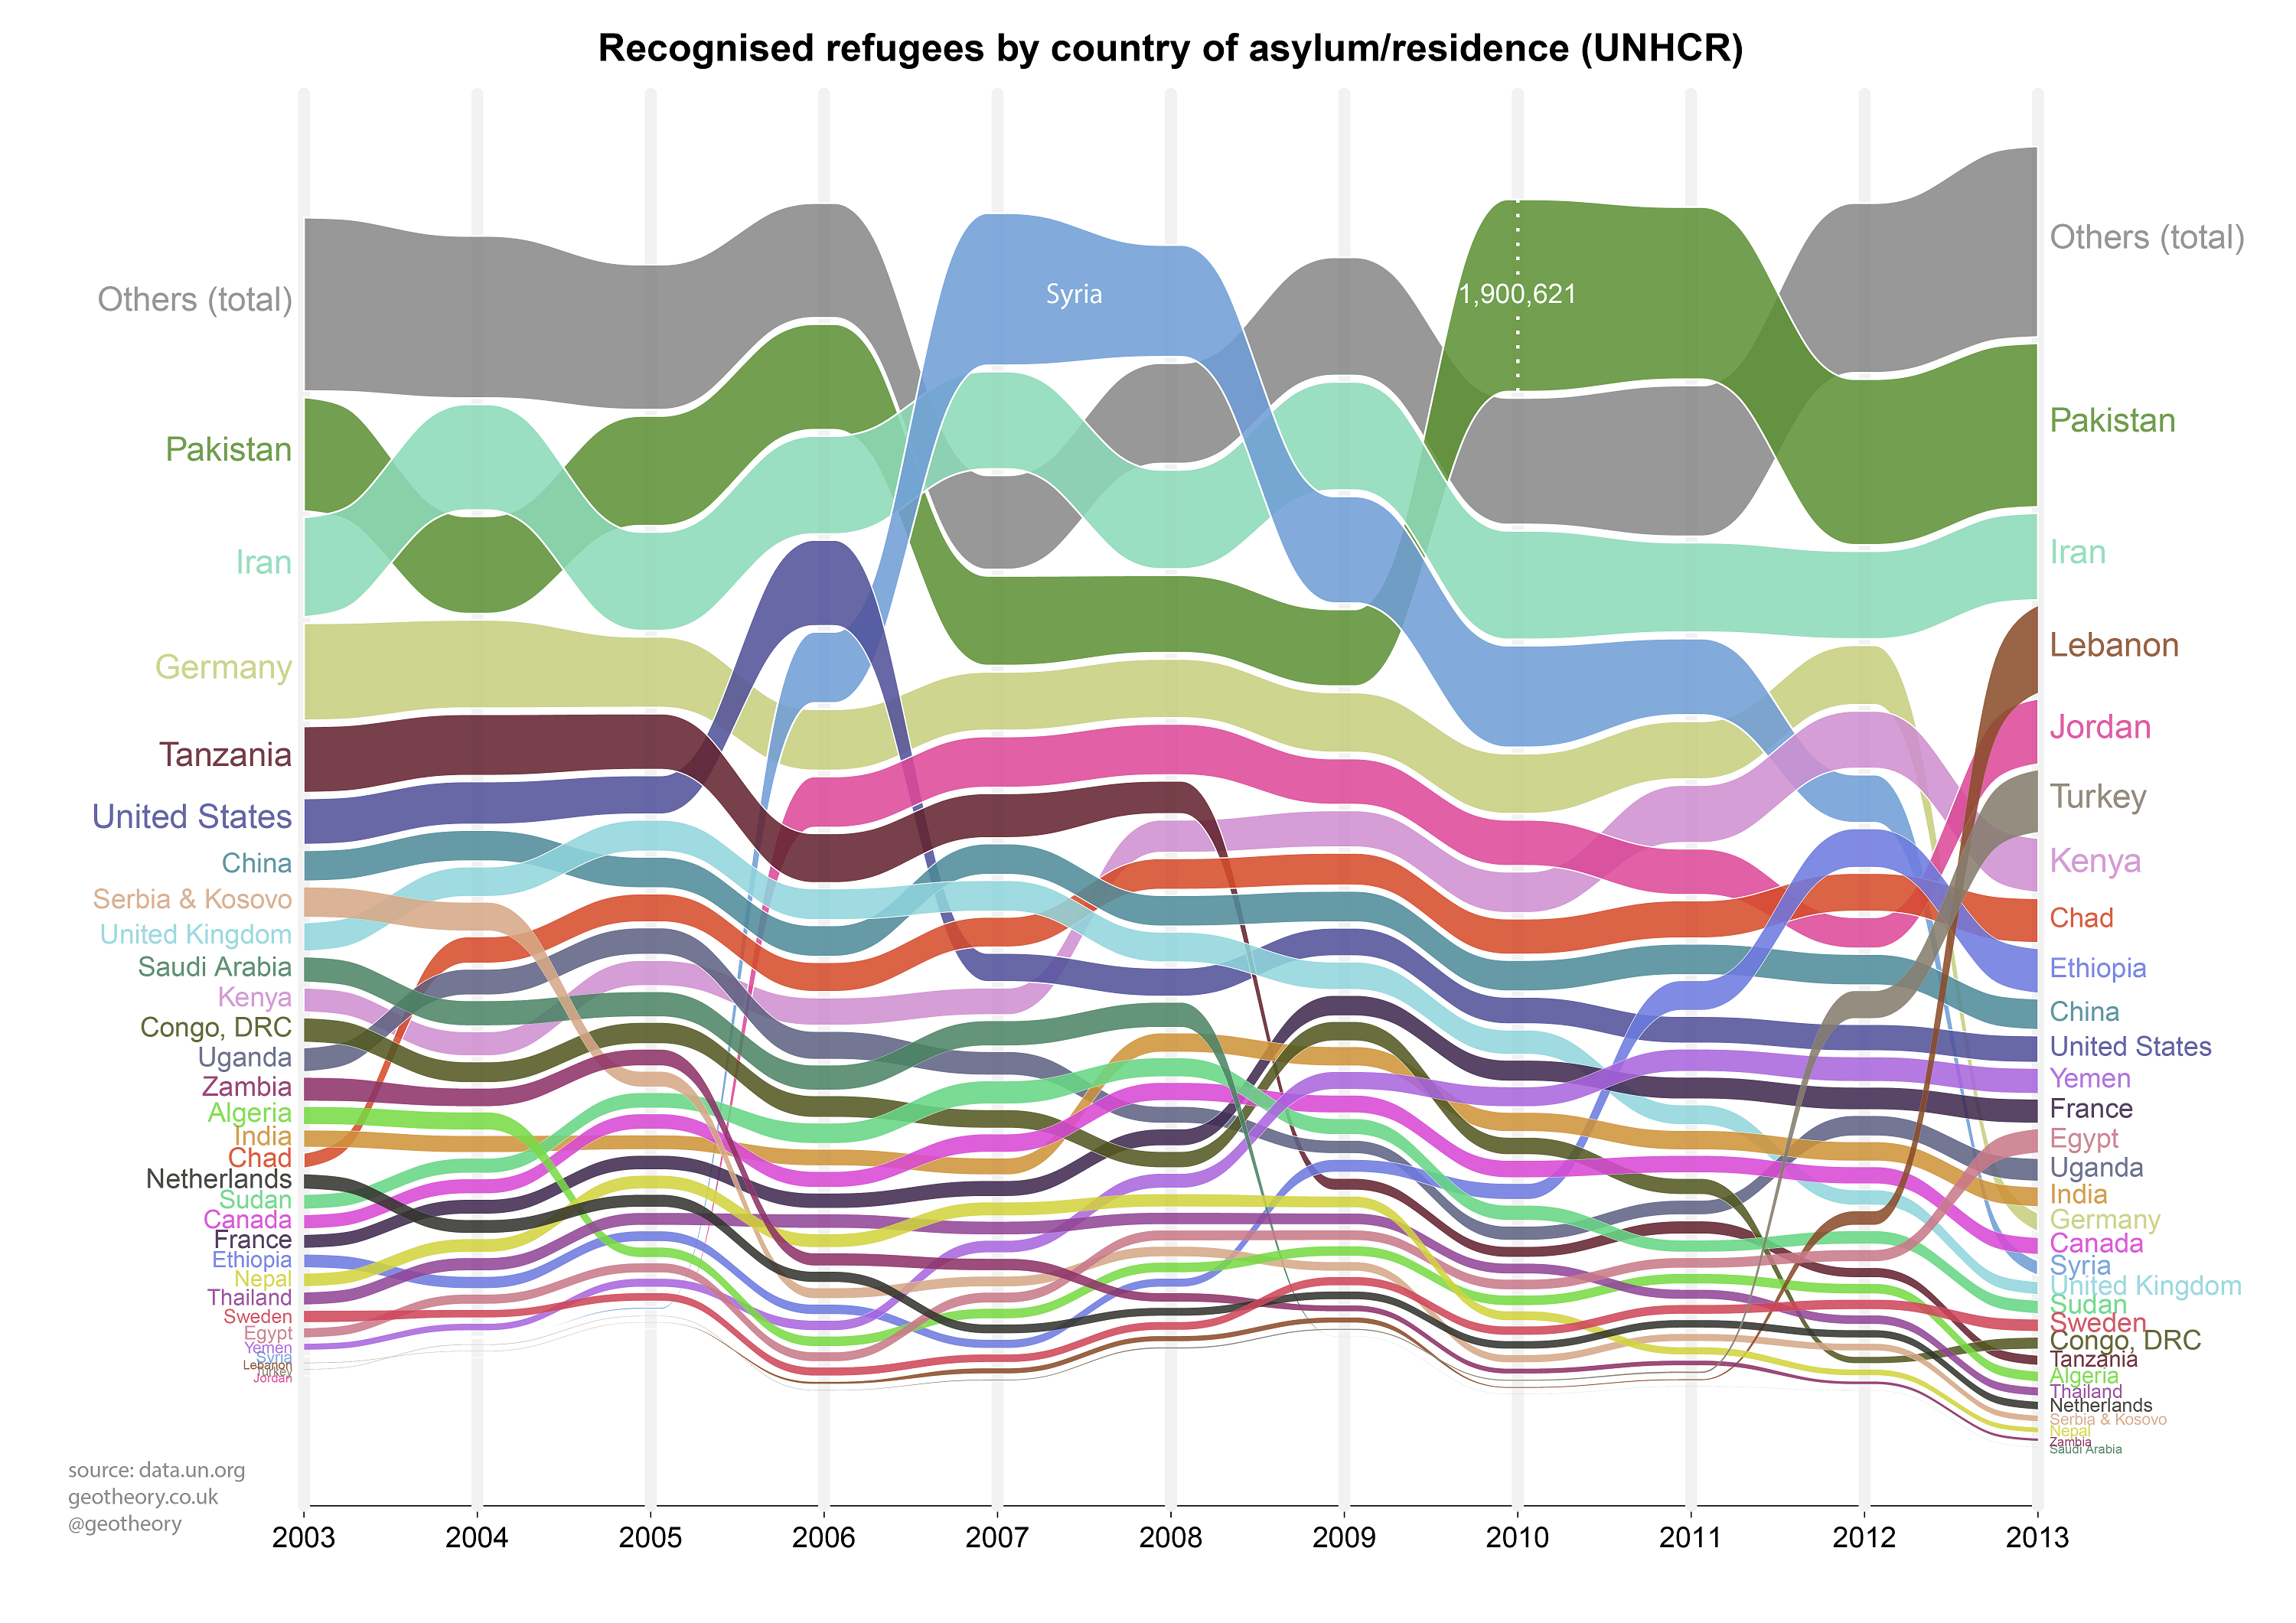
An appendum to yesterday’s post on time-series alluvial plots, this time looking at some data from UNHCR on refugee numbers over the past decade. Comparing the two graphs gives an idea where the majority of refugees from each conflict area have been registered by UNHCR (presumably not necessarily the final destinations for many).
The function that produced these is now available as part of the alluvial package available on github.
[Previously published at geotheory.co.uk]